MACD: A Simple Guide
Ready to elevate your trading game? Discover how the MACD indicator can guide you to smarter, more informed decisions.
- MACD Basics: Quick guide to key components.
- Easy Setup: Fast application on charts.
- Signal Interpretation: Identifying call and put cues.
MACD basics
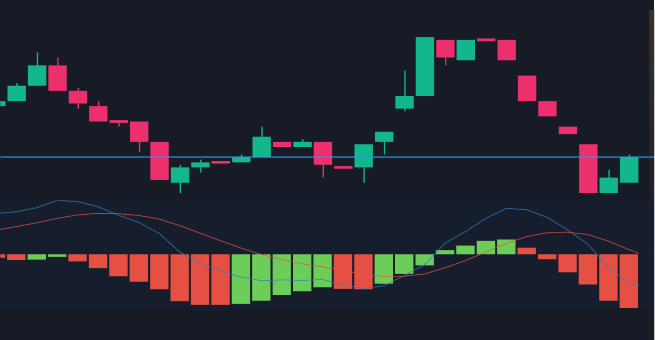
The Moving Average Convergence Divergence (MACD) is a momentum indicator that reveals the relationship between two moving averages of a price.
It's your go-to for understanding market trends at a glance, consisting of:
- MACD Line: Difference between the 12-day and 26-day EMAs.
- Signal Line: The 9-day EMA of the MACD Line.
- Histogram: Shows the difference between MACD and Trigger Lines.
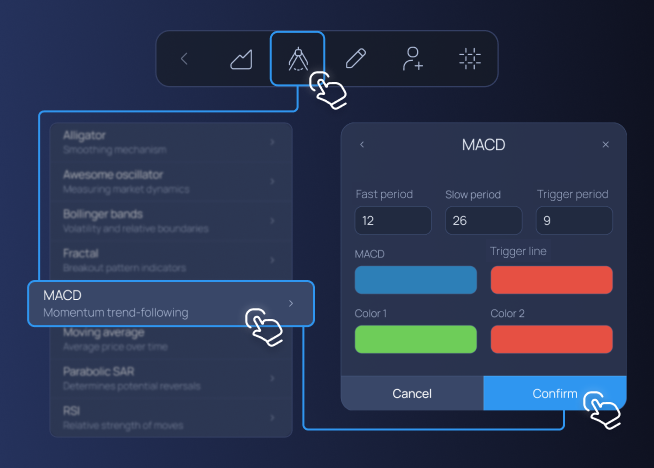
Easy setup
Setting up MACD is straightforward:
- Find and apply the MACD indicator from the analysis tools.
- Customize for clarity, adjusting colors and line thickness as needed.
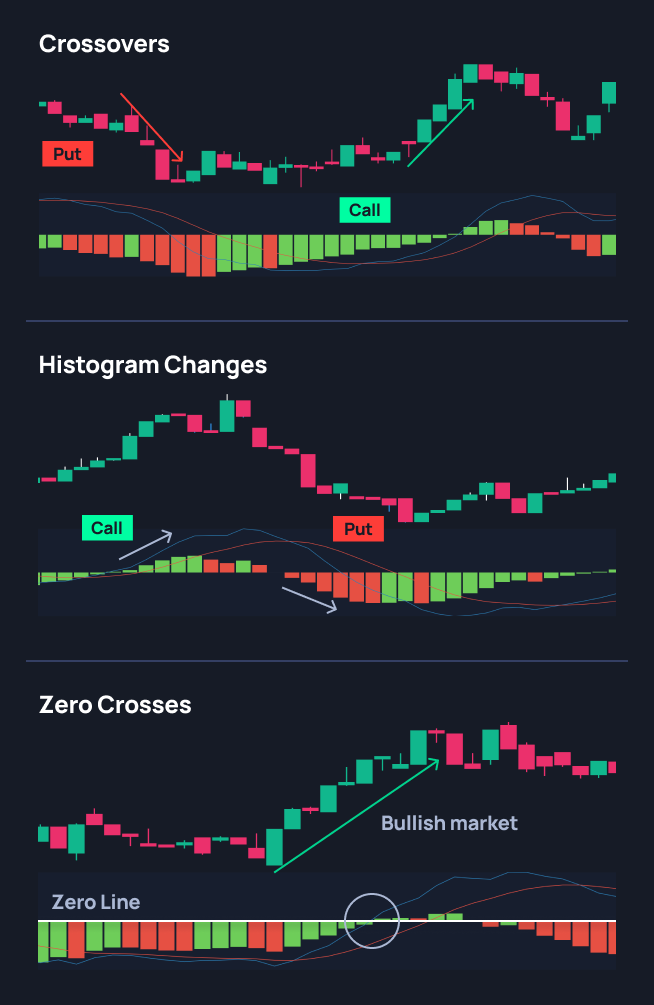
Signal interpretation
Reading MACD is like reading the mood of the market:
- Crossovers: MACD Line crossing above the Trigger Line suggests a call opportunity; below indicates a put one.
- Histogram Changes: A growing histogram indicates rising momentum;
shrinking suggests it's decreasing. - Zero Crosses: MACD Line crossing zero can indicate a bullish or bearish market shift.
Trade execution
Bullish Indication: Press “Call” when the MACD line crosses above the trigger line from below, indicating bullish momentum.
Bearish Indication: Press “Put” when the MACD line crosses below the trigger line from above, indicating a potential reversal to the downside.
MACD is more than just lines and histograms; it's a window to market dynamics.
Start experimenting with MACD on the platform, and watch your trading confidence grow!